SPOTIFY RELEASES BY GENRE
Examining the trends in Spotify's new releases in Australia with dynamic interactive graphs.
---
Overview_
Each week a large number of new releases are added to Spotify in Australia. Exploring the trends in volume of releases per genre, per week, could yield a useful descision-making tool for market share growth on the platform for a record label. This project explored a few of many ways to look at this data.
New release data was collected weekly and appended to the existing dataset for 12 months. The data was then transformed using Altair, a declarative statistical visualization library for Python based on Vega and Vega-Lite, into an interactive plot.
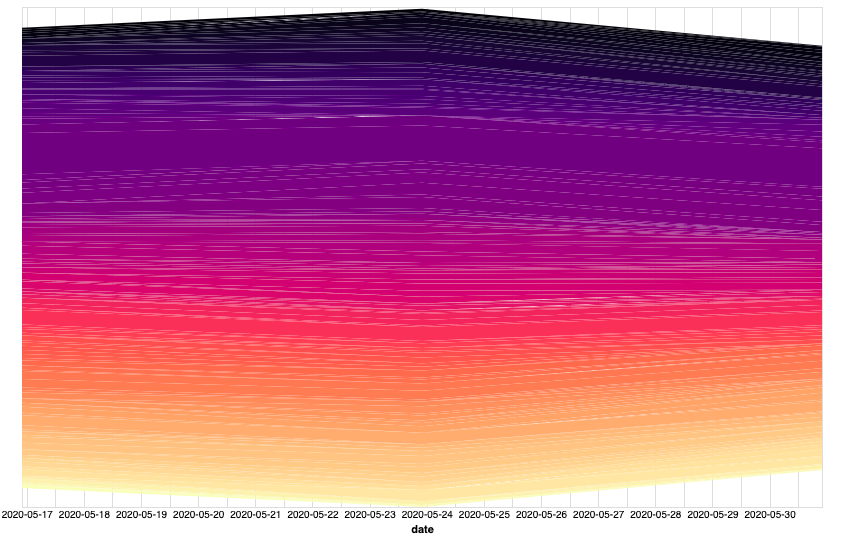
The graph below shows releases over time in Australia, with 'volume' being the number of releases from each genre each week.
Technology Used_
The code ran once a week on a stock Raspberry Pi 2 Model B sitting on a shelf in my home. It has a 900MHz quad-core ARM Cortex-A7 CPU and 1GB RAM.
The project was completed with Python. Here are a selection of the libraries used:
• Altair for interactive plotting.
• BeautifulSoup / Requests for web scraping.
• Pandas for data frame management.
• FTPLib for transferring files to this web server.
Analytics_
Below is an image of the interactive plot when it went live in it's third week of collecting data.

References_
I’ve collected a few resources for further reading:
• New Releases in AU on Every Noise At Once.
• Raspberry Pi 2 Model B product page.
• Altair Documentation.
© Copyright 2020 Tom Gilmore. All Rights Reserved.